Three.js
THREE.JS - DEBUG AND STATS
Using Dat.GUI
It will be hard to keep experimenting with the values of variables, like the position of the cube, until you get something that you like. It’s a kind of slow and overwhelming process. Luckily, there is already a good solution available that integrates great with Three.js, dat.gui. It allows you to create a basic user interface component that can change variables in your code.
Installation
To use dat.gui in your project, download it here and add the <script> tag to the HTML file.
<script type='text/javascript' src='path/to/dat.gui.min.js'></script>
Or you can use CDN, add the following <script> tag inside your HTML.
<script src="https://cdnjs.cloudflare.com/ajax/libs/dat-gui/0.7.7/dat.gui.min.js"></script>
If you are using Three.js in a node app, install the npm package - dat.gui and import it into your JavaScript file.
npm install dat.gui
or
yarn add dat.gui
import * as dat from 'dat.gui'
Usage
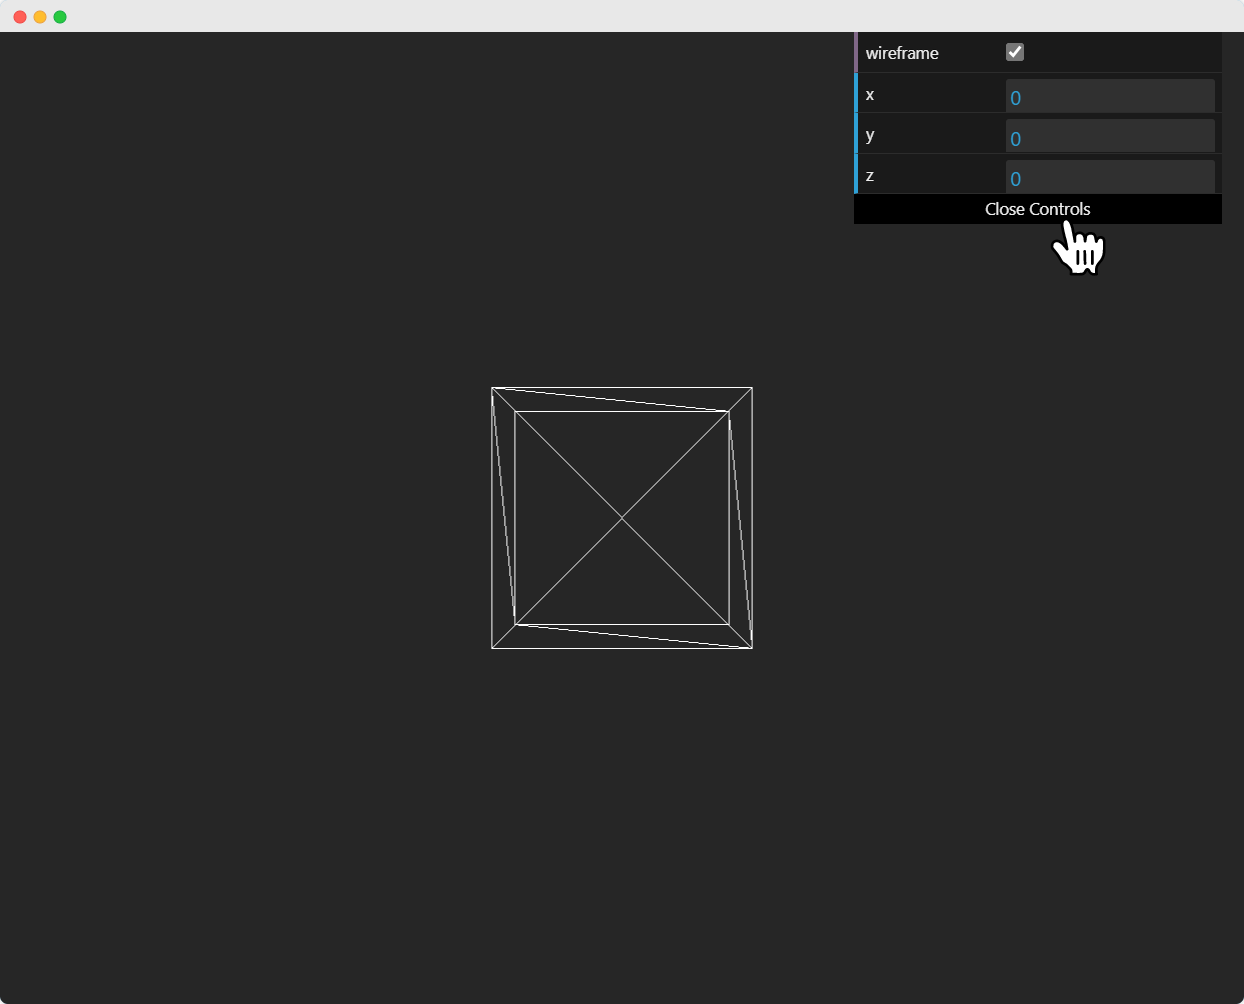
First, you should initialize the object itself. It will create a widget and display it on the screen top right corner.
const gui = new dat.GUI()
Then you can add the parameter you want to control and the variable. For example, the following code is to control the y position of the cube.
gui.add(cube.position, 'y')
Try adding other position variables. Refer to this working code example.
You can customize the label displayed using the name attribute. To change the label on the variable line, use .name("your label").
gui.add(cube.position, 'y').name('cube-y')
You can set up min/max limits and steps for getting the slider. The following line will allow values from 1 to 10, increasing the value by 1 at a time.
gui.add(cube.position, 'y').min(1).max(10).step(1)
// or
gui.add(cube.position, 'y', 1, 10, 1)
If there are many varibles with the same name, you may find it difficult to differentiate among them. In that case, you can add folders for every object. All the variables related to an object will be in one folder.
// creating a folder
const cube1 = gui.addFolder('Cube 1')

cube1.add(redCube.position, 'y').min(1).max(10).step(1)
cube1.add(redCube.position, 'x').min(1).max(10).step(1)
cube1.add(redCube.position, 'z').min(1).max(10).step(1)

// another folder
const cube2 = gui.addFolder('Cube 2')

cube2.add(greenCube.position, 'y').min(1).max(10).step(1)
cube2.add(greenCube.position, 'x').min(1).max(10).step(1)
cube2.add(greenCube.position, 'z').min(1).max(10).step(1)
You can also add some callback functions.
onChange is triggered once the value is changed.
gui.add(cube.position, 'y').onChange(function () {
  // refresh based on the new value of y
  console.log(cube.position.y)
})
Let’s see another example of changing color using dat.gui and callbacks.
// parameter
const cubeColor = {
  color: 0xff0000,
}

gui.addColor(cubeColor, 'color').onChange(() => {
  // callback
  cube.color.set(cubeColor.color)
})
The above callback .onChange notifies Three.js to change the color of the cube when the color from cubeColor is changed.
We are going to use this dat.gui a lot from now. Make sure you get to used to it by experimenting with the “Hello Cube!” app.
Stats
Statistics play an important role in large-scale applications. If you are creating a larger Three.js project with many objects and animations, it is good to monitor the performance of the code like fps(frames per second), memory allocated, etc. The creator of Three.js also created a small JavaScript library, Stats.js, to monitor the rendering.
Installation
Just like any other library, you can simply add it to your project in any of the three ways like discussed previously.
You can download it from GitHub and import it to your HTML page.
Or you can add the CDN link to the HTML page.
<script src="https://cdnjs.cloudflare.com/ajax/libs/stats.js/r17/Stats.min.js"></script>
If you’re using a node app, install the npm package and import it into your project.
npm install stats.js
or
yarn add stats.js
import * as stats from 'stats.js'
Functionality
You can monitor the following properties using Stats.js.
- FPS - Frames rendered in the last second (0).
- MS - Milliseconds needed to render a frame (1).
- MB - MBytes of allocated memory (2). (Run Chrome with –enable-precise-memory-info)
- CUSTOM - you can define the thing you want to monitor. User-defined panel support (3).
The fps and ms are monitored most commonly.
How does it works?
If you’re monitoring the frame rate, it counts how often the update was called within the last second, and shows that value. If you’re monitoring the render time, it just shows the time between calls and the update function.
Usage
You can add this functionality to your code in a few simple steps.
Create the stats object and add it to the HTML page using the dom.
const stats = new Stats()
stats.showPanel(1) // 0: fps, 1: ms, 2: mb, 3+: custom
document.body.appendChild(stats.dom)
Note: You can show the panel you want using showPanel(). By default, fps panel will be displayed and you can toggle between panels by clicking on the panel.
Select the code you want to monitor.
stats.begin()

// monitored code goes here
// in our case the render function
renderer.render(scene, camera)

stats.end()
If you are using animations, you should update the stats whenever the frame is rendered.
function animate() {
  requestAnimationFrame(render)

  // our animations
  renderer.render(scene, camera)
  stats.update()
}
Check this working example.